Pattern di inversione
L'analisi del riversione del prezzo nel mercato in base alle candele giapponesi.
Introduzione
- Trading con margine
- Cos’è il Forex
- Vantaggi del Forex
- Coppia di valute
- Lotto e operazione
- Trade: ordine, operazione, posizione. Tipi di ordini
Analisi tecnica
Analisi fondamentale
Psicologia del trading
- Psicologia del trading
- Perché il trading è difficile
- Fattori del trading di successo e consigli dei trader esperti
Gestione del rischio e del money management
- Concetto generale di money management
- Alcune regole fondamentali di money management
- Indicatori chiave per l’analisi del rischio
Creazione di una strategia di trading
I seguenti pattern sono legati alle figure di inversione:
A. “Hammer” e “Hanging Man”
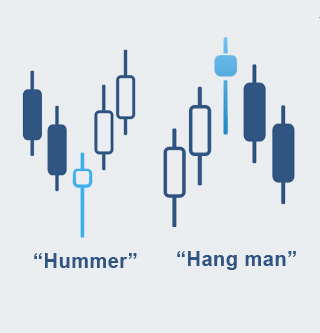
Candele di inversione:
- Il corpo si trova nella parte superiore (o inferiore) del range di prezzo. Il colore del corpo non è determinante.
- L’ombra inferiore è almeno due volte più lunga del corpo.
- La candela di inversione non presenta ombra superiore oppure questa è molto corta.
- Più lunga è l’ombra inferiore e più corta quella superiore, e maggiore è il corpo, più alto è il potenziale del segnale.
- Sebbene il colore del corpo non sia fondamentale:
- un Hammer rialzista indica un forte potenziale bullish;
- un Hanging Man ribassista indica un forte potenziale bearish.
Caratteristiche:
- Nel caso dell’Hanging Man, la conferma del segnale ribassista è fondamentale. Quanto maggiore è il gap ribassista tra il corpo dell’Hanging Man e il prezzo di apertura della candela successiva (timeframe successivo), tanto maggiore è la probabilità che l’Hanging Man segnali un massimo di mercato.
- La dinamica dei prezzi precedente caratterizza l’Hammer. Se prima dell’Hammer compare una candela con caratteristiche chiaramente ribassiste (ad esempio un corpo lungo senza ombre), ciò conferma il rafforzamento della pressione dei venditori. In questo caso è necessario attendere una conferma che i compratori abbiano ripreso il controllo, ad esempio una candela successiva con chiusura superiore a quella dell’Hammer. È importante verificare se l’Hammer rompe un livello di supporto significativo.
B. “Double Top” e “Double Bottom”
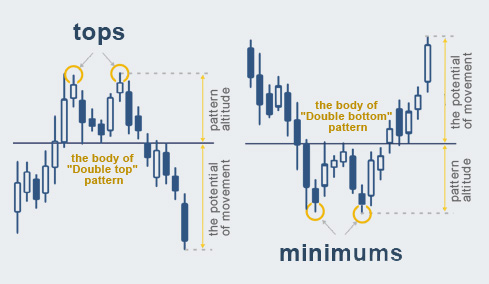 I modelli di inversione Double Top (passaggio da trend rialzista a ribassista) e Double Bottom (passaggio da trend ribassista a rialzista) si formano quando il prezzo crea due estremi locali, per poi rompere la linea alla loro base (linea di supporto in un trend rialzista o linea di resistenza in un trend ribassista).
L’illustrazione mostra i modelli classici di Double Top e Double Bottom. Il grafico del Double Bottom è lo specchio del Double Top.
Questo modello consente agli analisti di ipotizzare che, dopo la rottura del livello di supporto (nel Double Top) o del livello di resistenza (nel Double Bottom), il prezzo possa muoversi nella stessa direzione per una distanza pari o superiore all’altezza del pattern (dalla base al massimo o al minimo).
C. “Head & Shoulders” (Testa e Spalle) e modelli a tre massimi/minimi
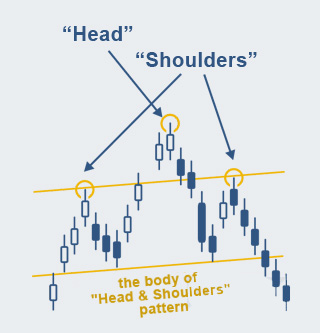 I pattern di questa categoria ricordano il Double Top o il Double Bottom. Le regole generali di costruzione sono le stesse descritte in precedenza, con la differenza che il modello presenta tre massimi invece di due. Analizzeremo solo la variante di inversione da trend rialzista a ribassista; la versione “speculare” (da ribassista a rialzista) segue le stesse logiche.
Il modello è composto da tre massimi. Se i due massimi laterali sono situati a un livello inferiore rispetto al massimo centrale, il pattern prende il nome di Head & Shoulders.
Se invece tutti e tre i massimi si trovano su livelli simili, il modello viene definito Triple Top. In caso di rottura della linea di base (neckline), il prezzo dovrebbe muoversi nella direzione della rottura per una distanza non superiore all’altezza del pattern stesso (dalla base al massimo più alto).